
The COVID-19 pandemic has shaken the world economy in a variety of ways. For one, it has significantly accelerated the process of digital transformation.
No wonder. Especially, when you consider that at a certain point almost all social and economic interactions moved online.
This has forced lots of businesses to channel their resources towards delivering better online experiences.
Did they succeed?
Well, almost 90% of online customers say their last shopping experience was positive.
This leads us to several burning questions, though:
- What is it specifically that makes an online shopping experience positive?
- Which elements of the puzzle do customers find crucial to pick one store over the other?
- What does the new generation of shoppers expect from online businesses?
Here’s what 1,004 US shoppers told us. Let’s explore customer experience trends that will define this decade.
Major Findings
Some of the most important customer experience statistics and insights that our study revealed include:
The majority of customers think that businesses don’t listen to their needs and opinions
Generation Z and Y are more likely to shop online on multiple devices
- While shopping, Gen Z customers are more likely to switch between devices than the remaining part of the adult US population. Almost 59% of them do it regularly, compared to 55% of Millenials, and only 40% of older customers.
Gen Z shoppers are the most loyal eCommerce customer segment
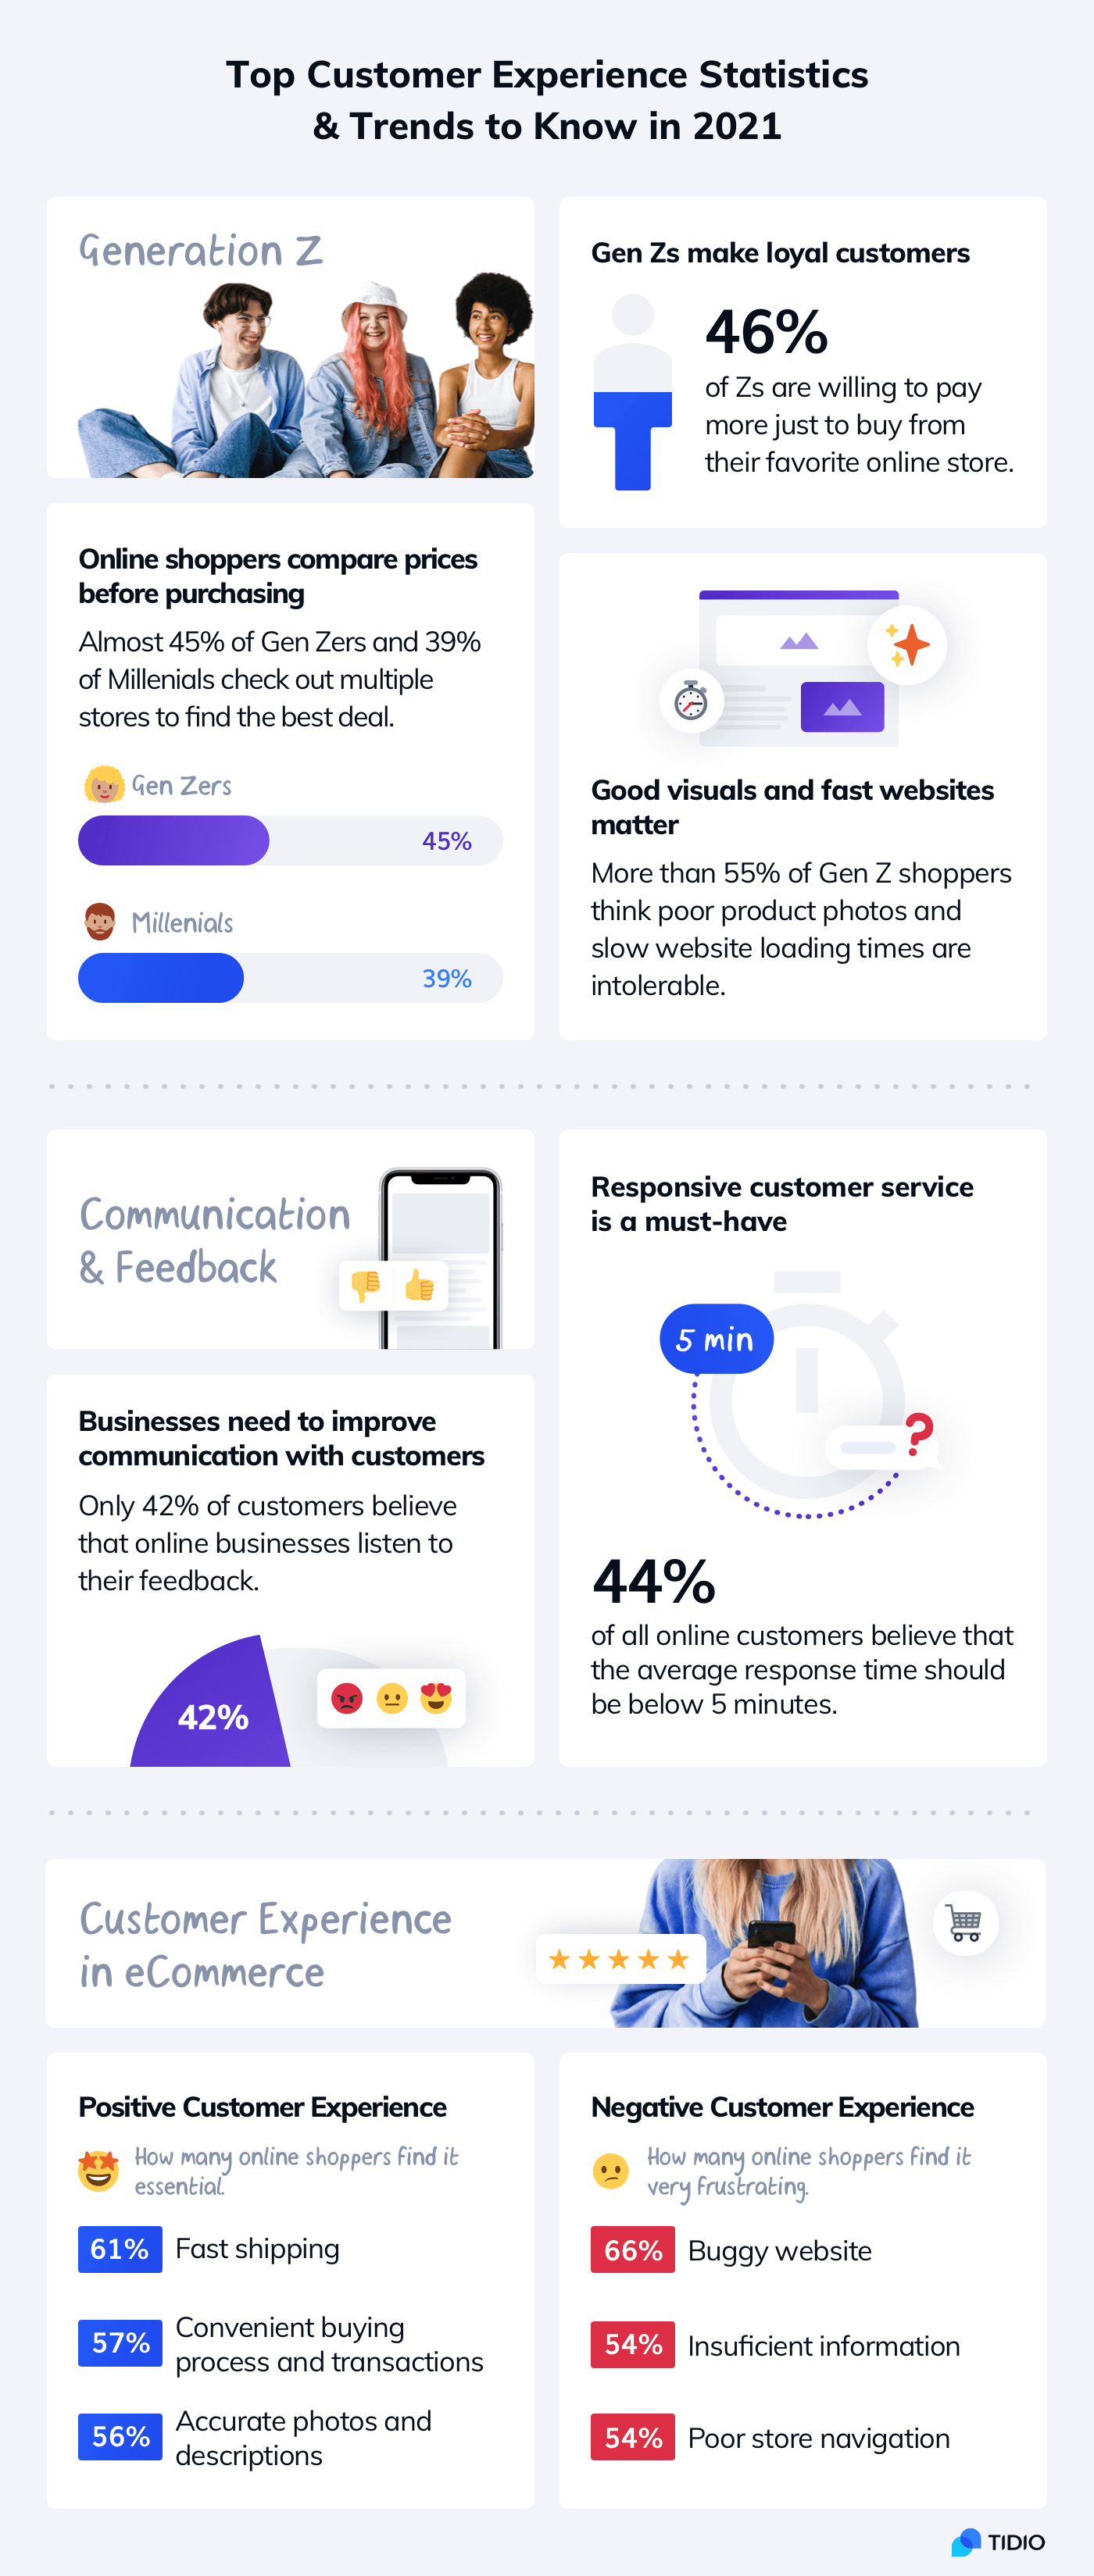
- 46% of Gen Z buyers are willing to pay more for the same product if they can shop in their favorite online store.
Faster customer service is expected to be a standard, not a luxury
- 44% of online customers believe that the average response time from customer service should be below 5 minutes (but they are not likely to pay extra for it).
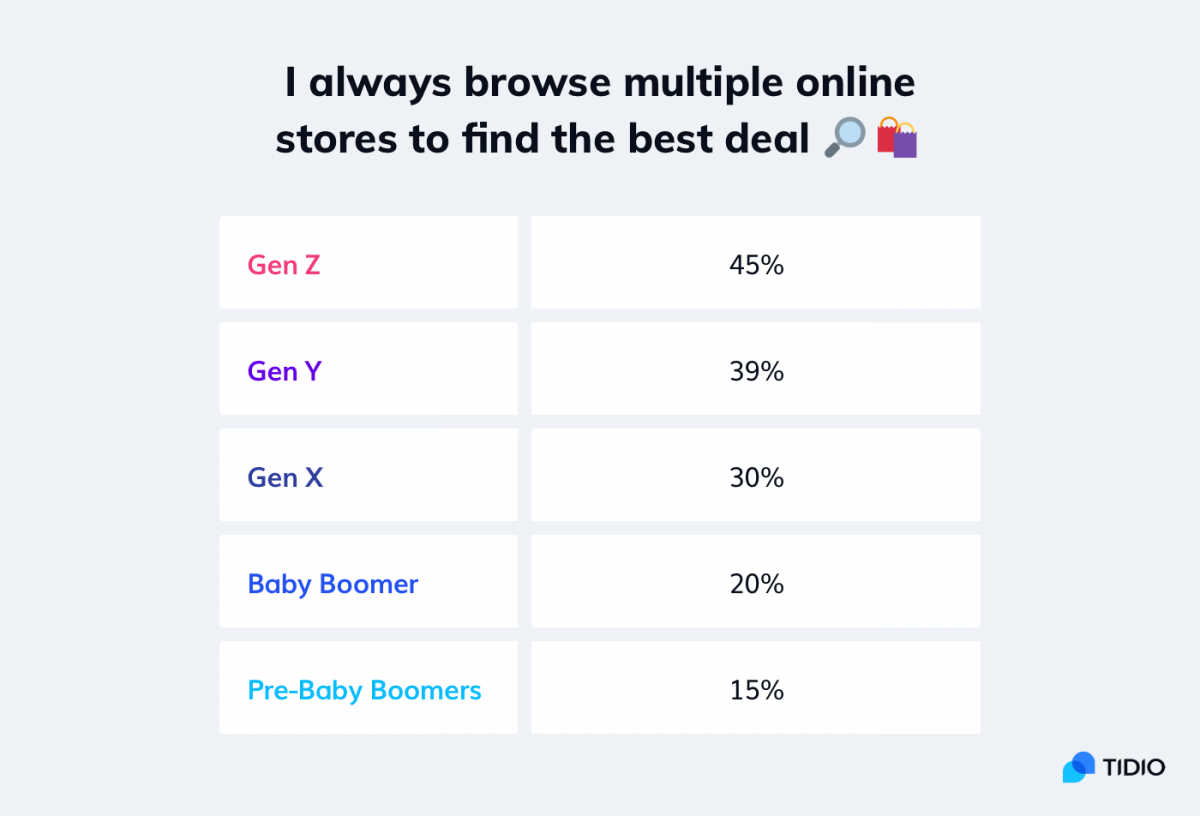
Cross-referencing and comparing prices are now standard parts of online shopping
- Almost 45% of Gen Zers declare that they browse many stores to find the best deal. This is a regular practice of 39% of Millenials and only 26% of customers above 40.
Poor visuals and slow websites make a negative customer experience for young shoppers
- More than 55% of online shoppers aged 18-24 think poor product photos and slow website loading times are intolerable. They find these aspects much more frustrating than other customer segments.
Businesses can redeem themselves if they underdeliver on the quality of customer experience
- Only 18.5% of US customers would stop buying from a company after one bad experience. The majority of shoppers give businesses at least two or three chances.
Top 27 Customer Experience Statistics to Know in 2021
Fast shipping, frictionless transactions, and accuracy of product information are the top three factors for the positive customer experience for the vast majority of customers.
But Gen Z shoppers are a new species. As the first generation of true digital natives, they are very analytical and conscious buyers. They also have a different set of expectations towards businesses.
Let’s look at some general trends before diving into detailed customer experience statistics. Here are some insights from a report by Pew Research Center and Meet Generation Z—an episode of the McKinsey Podcast.

Other generations shop primarily to show their status or invest in experiences. Gen Zs, on the other hand, love shopping because it helps them express who they are. To illustrate it, let’s think about it this way:
- A Baby Boomer buys a Rolex to show that he can afford to buy a luxury item from a respected, premium brand (status)
- A Millennial buys an exotic trip and a new iPhone to record it (experience)
- A Gen Z shopper buys personalized products from their favorite niche store to express their values (identity)
In several years, Gen Z’s consumer buying power and disposable income will rise. The 2020 edition of Drapers’ consumer research reports that Gen Z wields around $150bn of spending power in the United States alone. Very soon, they will become the most important customer segment for many companies. That’s why they play a special role in our customer experience study.
While some of the findings confirmed well-known trends and predictions, there are still some surprises. Read on to find out more insights about customers’ behavior patterns, their soft spots, and pet peeves.
1. General Attitudes Towards Shopping Online in 2021
The majority of customers enjoy shopping online and are very enthusiastic about it. They also do it on a regular basis and usually on many devices. There appears to be a strong correlation between the age/gender of respondents and their level of engagement.

Additionally, 29% of respondents aged 18-24 strongly believe that people should buy even more things (like groceries) online. Only 18% of customers aged 40+ share this view. As the main arguments for online shopping, Gen Zs mention:
- Lower prices, even after adding the shipping costs
- A wider selection of products compared to traditional brick and mortar stores
- Shopping online is convenient and saves time
- No need to queue or meet with other people (which can be annoying)
2. Most Popular Devices for Online Shopping
Convenience is essential for building a good customer experience. Online shoppers must be able to browse products and complete their orders in their favorite way. More than 3 in 5 adult US customers would not purchase a product if the website was difficult to navigate on mobile phones.
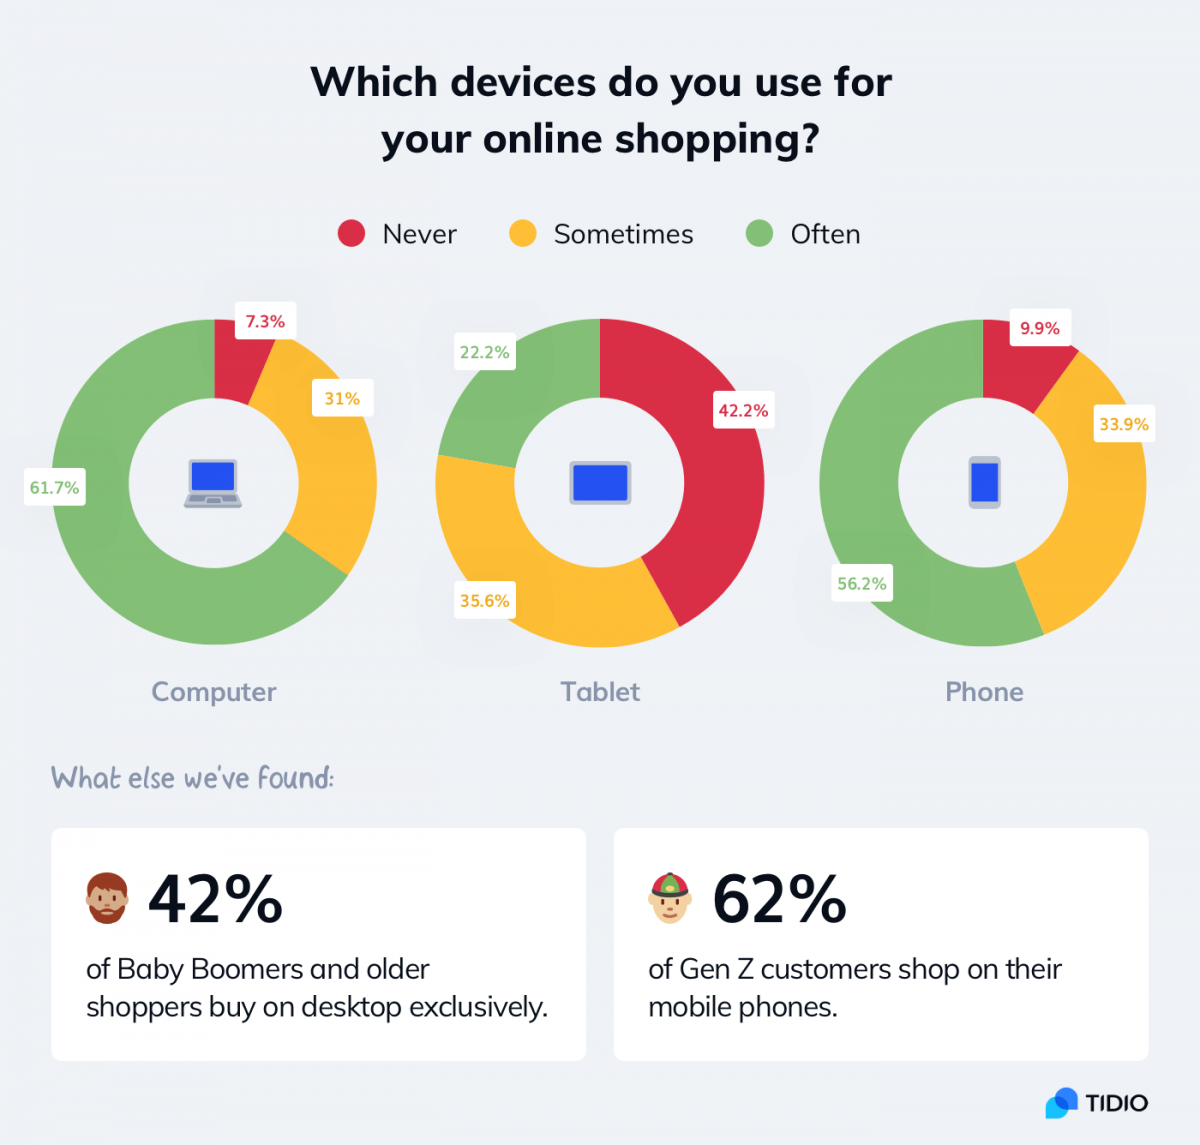
Almost 50% of shoppers switch between devices while shopping. This is especially true of the youngest customer segment. Generation Z customers were exposed to digital devices and new technologies throughout their entire life. A college kid can browse their favorite store while riding a bus, order on their laptop later during the day, and track the shipping on their smartphone via custom notifications.
Switching between different devices facilitates multi-touchpoint shopping sessions. Businesses that do not offer a frictionless way of doing this, may consider redesigning some of their processes and solutions. Otherwise, they may put off a whole new generation of shoppers.
Younger consumers tend to use their smartphones for shopping more frequently but computers are still the most popular option. Gen Z buyers choose desktop devices most of the time (67% respondents). However, 62% of them shop on their smartphones on a regular basis. Other mobile devices, like tablets, don’t enjoy such popularity.
3. Communication Channels—Preferences Across Customer Segments
To deliver a good customer experience, businesses need to use the right channels. And the ones favored by their customer base are the best bets.
Email remains the most universal communication channel. It is accepted by all generations. The customer service statistics below show an interesting trend—Gen Z shoppers are the ones who believe that nothing beats the good old phone. It is one of the preferred channels for customer-business interaction for 70% of them.
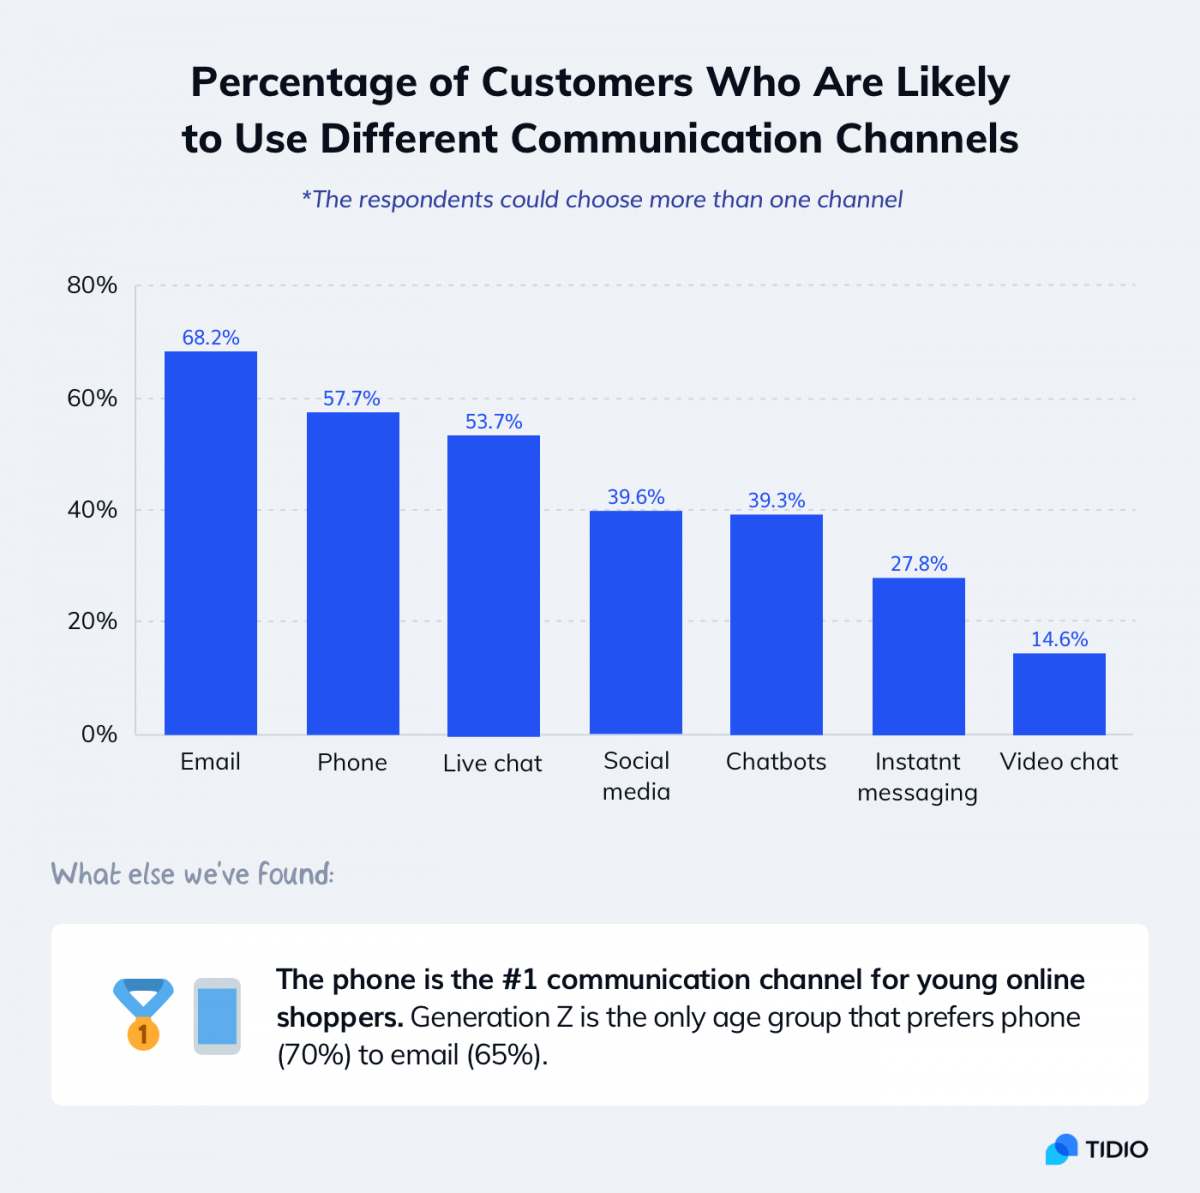
A customer experience transformation report from 2018 by NICE inContact also mentions phone, email, and live chat as the three dominating channels of preference. According to their customer experience statistics, the phone is preferred by 69%, email by 58%, and chat by 53% of customers.
4. Money Can’t Buy Loyalty (But Good Customer Experience Can)
Almost 35% of all respondents visit multiple stores to compare prices. However, for Gen Z this number goes up to 45% of shoppers.
Gen Z shoppers have been described as hypercognitive. They don’t mind comparing and cross-referencing lots of information. But the price is just one of many factors. Previous experiences with your company, reviews, or relatability are all taken into consideration.
Once they do the math and your business seems to be the best choice, Zs become loyal customers. They won’t even mind higher prices or paying extra for additional services!
Over 46% of Gen Z buyers are willing to pay more for the same product if they can shop in their favorite online store. Gen Y shoppers are also quite loyal, with 39% willing to choose a store they like even if prices are higher. This is something that only 22.8% of shoppers aged 40+ would do.
This trend was predicted almost a decade ago in a famous customer experience study “Customers 2020” by Walker. They argued that by the end of 2020, the quality of customer experience—not the price—will become the main factor that drives sales and builds loyalty.
5. Which Positive Customer Experiences Increase Sales
The most important aspects of the online shopping experience that drive sales are linked with speed and shopping convenience.

Almost 78% of frequent online shoppers mention fast shipping and 73% accurate photos and descriptions. The third most important factor—selected by 72% of them—is the convenient buying process and easy transactions. These three elements also overlap with factors pointed by remaining US shoppers.

It is worth noting that the most active online shoppers appreciate responsive customer service even more than good comments and product reviews. Also, being able to shop on mobile devices is quite crucial for this customer segment (selected as very important by 49.6% of customers).
The least important factors in making purchase decisions chosen by US customers were:
- Additional services related to products like gear waxing, custom engravings, fine-tuning (9.6%)
- Receiving access to exclusive resources and videos for paying customers (12%)
- Reading about the history of a business and its background (14.1%)
Some studies—like the 2021 report about customer experience trends by Core dna—suggest that “going behind the scenes” is really beneficial for building a strong brand image. This reportedly translates into better customer experiences. However, according to our research, there are many other aspects you should address first.
We have asked open-ended questions in which respondents described what helps them decide to buy products online. We put their responses into categories and we discovered some interesting patterns. The customers mostly mentioned:
- Good prices (29%)
- Good online reviews and opinions of friends and family (21%)
- A wide selection of products (15%)
- Free shipping (13%)
- Good return policy (11%)
- Receiving a discount (9%)
- Easy transactions with the favorite paying method (6%)
Some of the less popular but interesting factors mentioned repeatedly by respondents were:
- Inclusion and representation in marketing materials
- Ethical business practices
- Products are not harmful to the environment
- Supporting local communities
- “Made in the USA”, i.e. showing patriotic values and operating locally
- BitCoin available as a payment method
6. What Makes a Bad Customer Experience and Irritates Online Shoppers
Buggy websites, lack of information (like product availability or shipping costs), and poor site navigation are the most frustrating factors which affect the quality of customer experience.
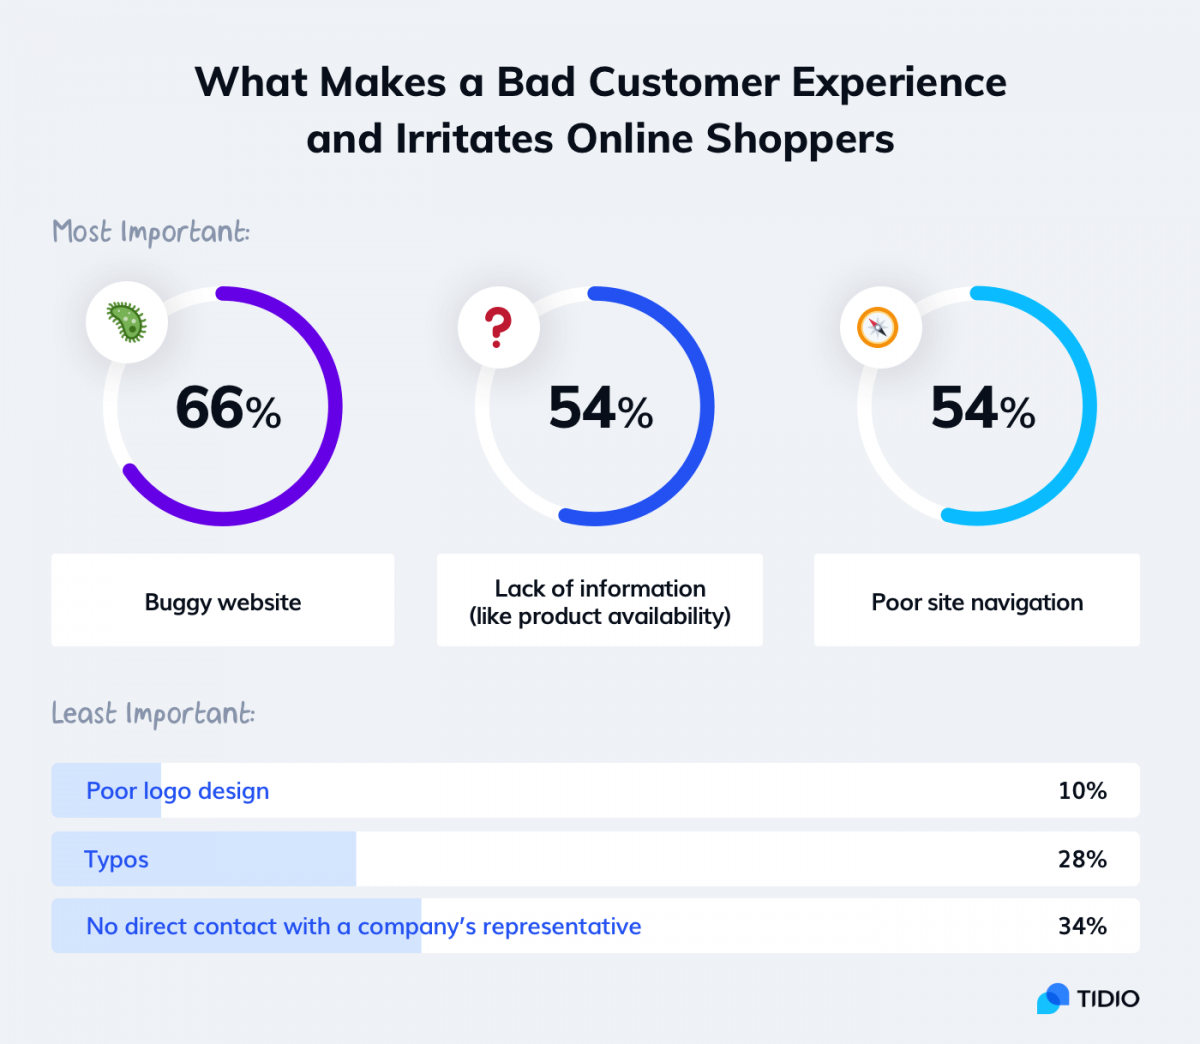
Gen Z shoppers are also very attentive to aspects such as slow loading times and the quality of product photos.

Gen Z shoppers are slightly more emphatic and understanding when it comes to waiting for customer support to respond. However, they won’t cut businesses any slack on the website’s poor performance or navigation. Slow loading times make them very frustrated 29% more frequently than general adult US shoppers.
How fast customer service should be for a positive customer experience?
Almost 44% of online customers believe that the average response time from customer service should be below 5 minutes. Interestingly, female shoppers seem to be less patient. 47.4% of them think that 5 minutes mark the difference between fast and slow customer service, compared to 40.3% of male respondents.
Interestingly, there were many other problems our respondents mentioned. Almost 7% of customers explicitly mentioned items that are out of stock. Another 5% are irritated by what they believe to be fake reviews.
Other things that customers frequently mention include:
- Deceptive advertising
- Insufficient information about shipping
- Items not packed properly
- Rude customer service
- Unclear return policies
- Problems with using the search function
- Pricing that seems suspicious/too good to be true
Several of the respondents mentioned two mutually exclusive “problems”:
- Lack of diversity in advertising
- When a company “goes SJW”
We highly recommend addressing the first one. A report by Pew Research Center points out that 48% of Gen Zs in the US are racial or ethinic minorities.
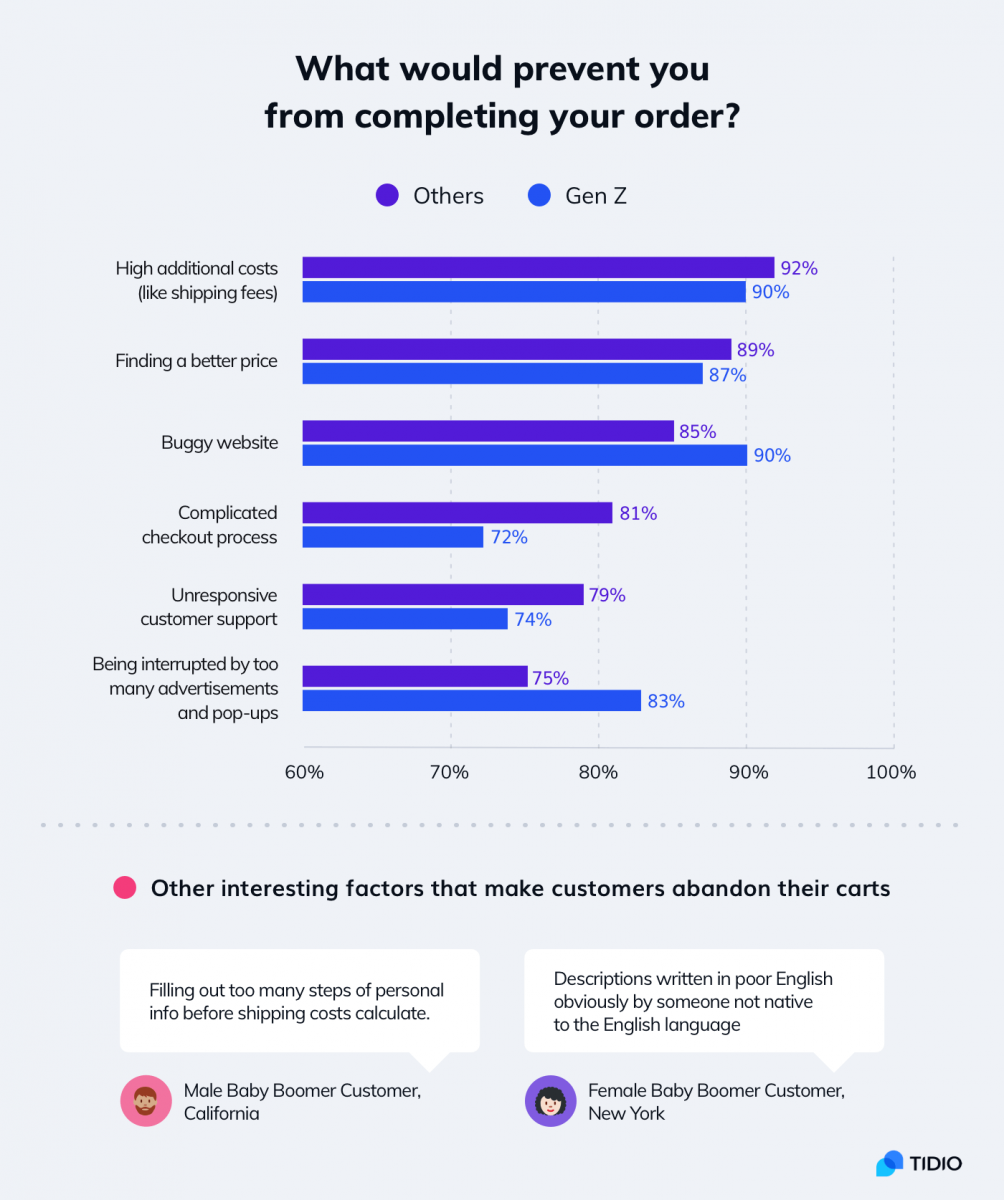
7. These Customer Experience Issues Are the Reason Why Customers Aren’t Buying From You
The two most important factors that make online shoppers abandon their shopping carts are discovering additional costs (shipping, taxes, etc.) and finding better prices somewhere else. While lowering prices (to always beat your competitors) is not a sustainable positive customer experience-building strategy, there are many other things to consider.
Gen Zers don’t notice technology until something glitches. Their smartphones are like a pair of glasses—they need it, use it all the time, but they are not consciously thinking about using/wearing them. Until they break.
In a similar way, as soon as they notice your website will not reload when it should, or pictures won’t show, they will be gone forever. For Gen Zs, buggy websites are the most important detractor—pointed out by 90% of respondents.
If there is one thing they want to rely on, it’s tech. They will understand it when there is a human error or when a customer service agent needs more time to respond. But the tech is supposed to work.
Gen Z customers are slightly less likely to order from a different store because of better prices (87% vs 89%) but are more likely to choose a store with the same product and better reviews (75% vs 61%).
Buyers in this age bracket also pay more attention to visual aspects. About 42% of the youngest generation of shoppers would not purchase a product from a website that has ugly graphics. Poor-looking visuals would discourage 37% of Gen Y and only 29% of older shoppers. But for female Gen Z customers, it’s almost half (46%).
Gen Z customers don’t abandon their shopping carts because of complicated checkout processes or being forced to create an account. They also don’t mind pricing in foreign currencies that much. About 41% of Gen Z customers would not be discouraged by prices not displayed as USD while only 29% of older shoppers would risk making such purchases. However, Zs are much more irritated when exposed to too many pop-ups and advertising. About 83% of them would stop buying because of frustrating ads.
8. Customers Are Willing to Pay More to Get Unlimited Free Shipping
Customers believe that some things, like newsletters or 24/7 support, should be a standard and they are not willing to pay extra for them. Unlimited free shipping seems to be the only prominent deal-breaker. Over 40% of customers are willing to pay extra to get access to unlimited free shipping (that would implicitly save them money in the long run).
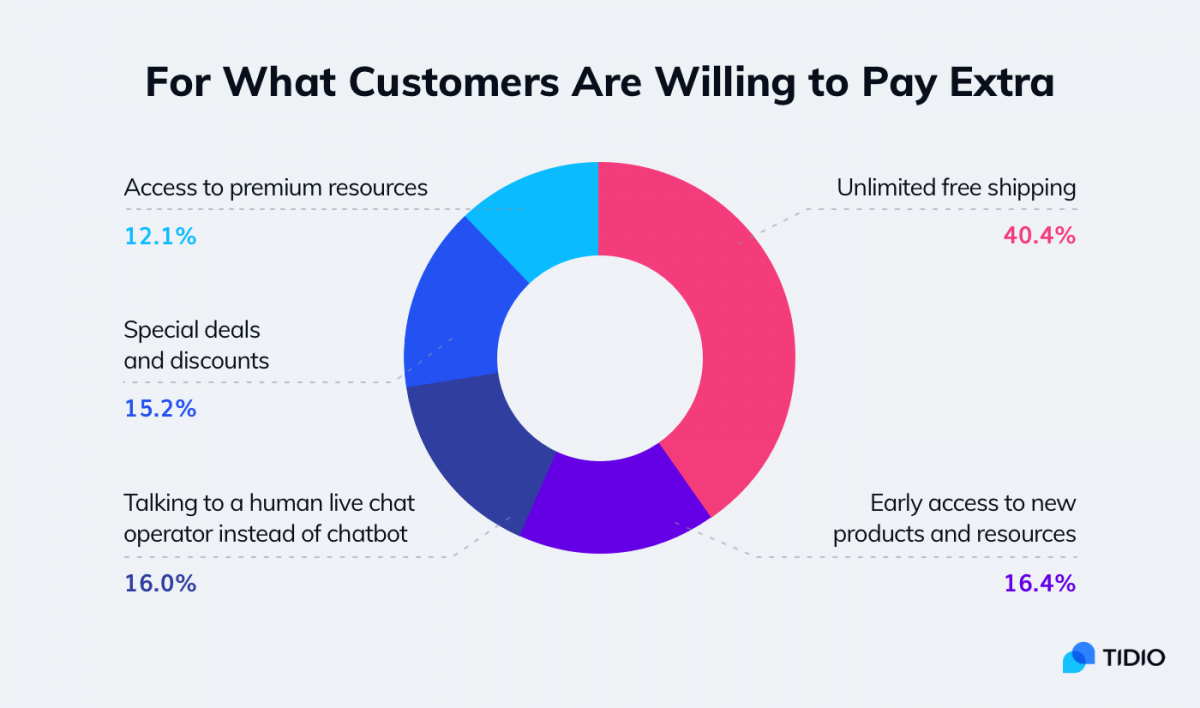
Gen Z shoppers are slightly more interested in paying for the sake of getting access to exclusive resources—almost 15% of young shoppers believe that premium content would convince them to make a purchase.
A recent report by Gartner about top consumer trends suggests that in 2021 it may be necessary to create separate marketing and communication strategies for different tiers of customers. One general message seems to be no longer working for all customers. It is more effective to identify which products or services are for affluent customers who expect premium customer experience and are willing to pay extra for it.
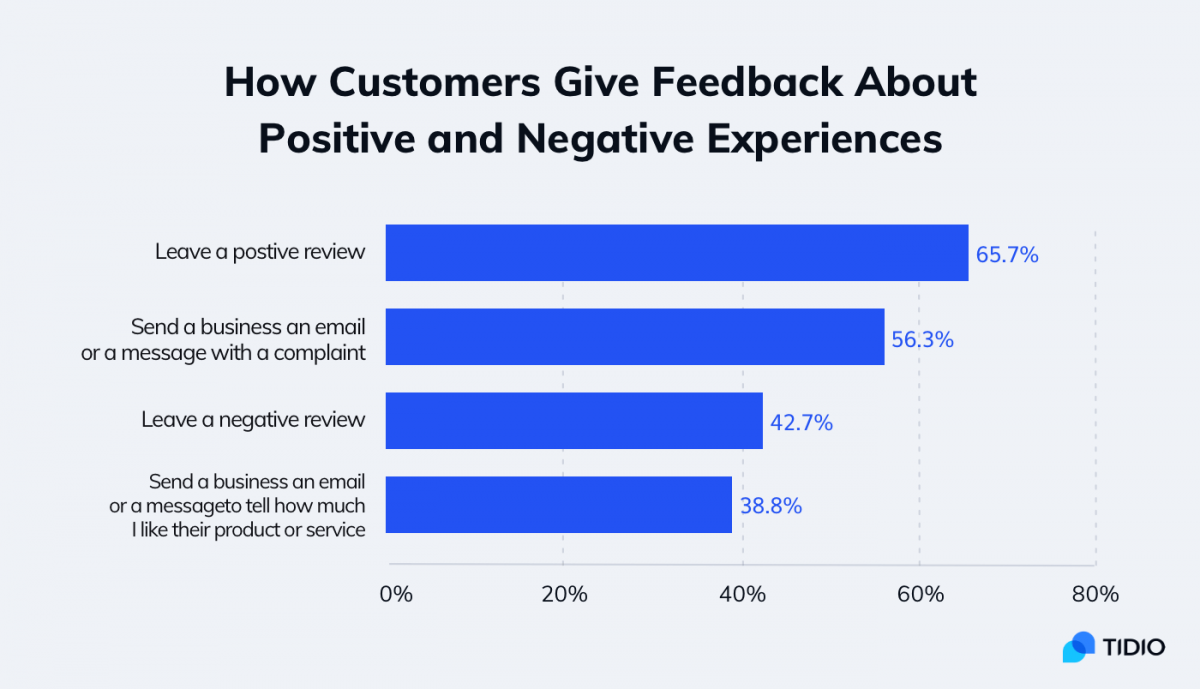
9. How Customers Share Feedback With Online Businesses
According to a recent customer experience survey by PWC, 82% of US customers want more human interaction and want to experience more of it in the future. Our survey results testify to this trend. Almost 46% of respondents expect real-time help via phone/live chat and find it critical in customer-business communication.

A very close number (45%) want to get in touch with a real person when complaining about a product or service. Sharing insights or giving kudos to a company is not perceived as important (with only 14% and 19% of respondents finding it essential).
Customer Service “Facts”
According to common customer service “knowledge,”, if a customer has a bad experience they will tell 10 people about it. This dates back to the 1980s—a customer service study for Coca-Cola, to be precise. Today, a bad customer experience can be shared with millions of Internet users instantly. All it takes is several clicks. If someone wants to contact you directly to complain, use this opportunity to take the blow. A chat with you or your agent is better than a negative comment or review.
US shoppers leave positive reviews when they are satisfied (66%) and contact company representatives directly when they want to complain (56% of respondents). Almost 26% of customers don’t do anything even when they are dissatisfied. It suggests that online shoppers praise their favorite business publicly but when they criticize they don’t publish their feedback online. This means that the number of negative reviews is usually lower than it should be.
Almost 12% of customers declare that they are very likely to leave a review if they are explicitly encouraged to do so (in an email or a message). However, this number would more than double (26%) if they were offered an incentive (like a discount code or points). Still, if you want to make incentivized reviews part of your marketing strategy, you should be extremely careful. Make sure that what you do is compliant with FTC regulations and that your practices won’t spawn predatory customers.
According to a customer experience evolution report by SAS, as many as 90% of businesses believe that they deliver the highest quality of customer experience. Companies prioritize customer experience as a relationship-building business strategy. However, the majority of online shoppers don’t feel that their voice as customers is being heard. Only 42.2% believe that online businesses listen to their feedback.
Almost 47% of male and 39% of female online shoppers respectively don’t think that companies care about their opinions and experiences. Female shoppers feel especially ignored, which may result from the different types of expectations they have. This phenomenon was discussed in a research study “Men Buy, Women Shop” from Wharton’s Jay H. Baker Retail Initiative.
Obviously, reviews are not everything. There are other ways consumers show their attitude towards a company. According to additional open questions from our survey, approximately 23% of respondents express their satisfaction simply by buying/not buying again from a business.
A customer experience report by PwC suggests that 32% of customers are willing to leave the business after just one negative experience. According to our research, this number seems to be slightly lower, around 18.5%.
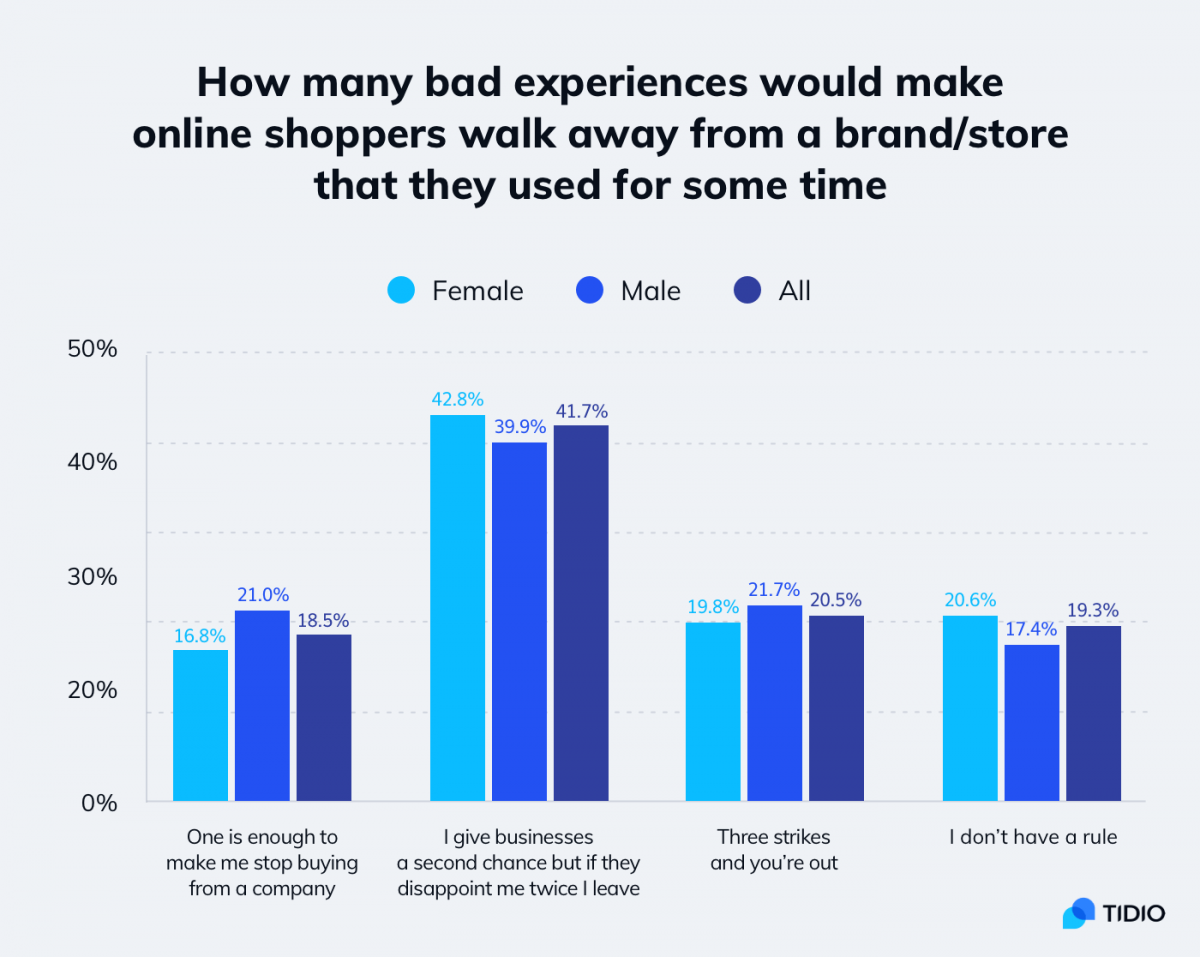
The majority of US customers are willing to give businesses multiple opportunities to right their wrongs. Only 45% of unsatisfied customers (with negative or very negative customer experiences) declare that they won’t buy again from the online store that recently disappointed them.
If your customers are dissatisfied, you shouldn’t worry or take it personally. They are still far more likely to buy from you again than random visitors. More than 62% of customers give businesses at least 2-3 chances.
Most US customers give businesses a second chance if they are dissatisfied. There are no significant differences between different age groups. However, customers who stop buying from a company after just one bad experience (18.5% of adult online shoppers) are mostly male.
10. Customer Experience Insights From Real Cases Described by Respondents
The most frequent problems our survey respondents encountered the last time they were shopping online were related to:
- Shipping and delivery (34.5% of customers)
- The buying process and transaction (27.6% of customers)
- Accuracy of product description and photos (20.7% of customers)
Positive customer experiences were linked to:
- Fast delivery (60.7%)
- Attractive prices (52.3%)
- Fast order processing (49.0%)
- Easy website navigation (33.7%)
- Good-looking website (15.3%)
- Helpful customer support (12.3%)
We asked all respondents which factors contributed to making their customer experience good or bad. It turned out that positive and negative customer experiences are not just mutual opposites.

Customer happiness writes white. Some aspects are more likely to be remembered and evaluated in the context of the overall shopping experience and its quality.
For example, while good website navigation helped to create positive experiences in the case of 37% of satisfied customers, only 14% of unsatisfied ones complained about this particular aspect.
Helpful and responsive customer support is transparent in positive experiences. But when customer support agents are rude or cannot solve a problem, this element of the shopping experience becomes just as painful as slow order processing.
To summarize what makes a perfect online customer experience in 2021:
- Prioritizing factors which directly affect the speed and convenience of shopping
- Website that is easy to navigate (also on mobile devices) and is free of technical issues
- Accurate photos, product descriptions, and information about their availability
- Customer reviews that appear legitimate and marketing materials that are relatable but not intrusive
- Speaking the language and using the communication channels favored by your customers (like phone, email, and live chat)
- Easy transactions and multiple payment methods available
- Fast order processing and delivery (preferably without additional charges)
- Listening to customers’ feedback and taking into account that negative opinions are usually only the tip of the iceberg
Sources:
Methodology:
For this study about customer experience trends, we collected answers from 1,004 US respondents. We used Amazon’s Mechanical Turk.
Respondents were 48.1% males and 51.9% females. The sample’s average age was 39 with a standard deviation of 13. Considering such age and gender makeup, the study’s findings can be extrapolated to the general US population.
Respondents had to answer about 100 questions the majority of which were scale-based or multiple choice. The questions related to positive and negative customer experiences and online shopping preferences. The survey had one attention check question. Since the respondents’ experience is subjective, we acknowledge that some of the answers might have been subject to such cognitive biases as recency, attribution, or exaggeration.
Fair Use Statement:
Has our research helped you learn more about emerging customer experience trends? Feel free to share eCommerce and customer service statistics from our study. Just remember to mention the source and include a link to this page. Thank you!
Source: Top 27 Customer Experience Statistics to Know in 2021